Guys, I've got some data about fuel prices and have validated the assumptions to a more realistic estimate. I was reluctant to comment on the break even period till now but with the historical trend, I think comments can be made.
I found the information on fuel prices here:
TABLE-Fuel prices in India's capital since 2000 | Reuters
The above link gives the prices from 2000 to 2011.
Also:
TABLE-India's petrol, diesel, kerosene and LPG prices | Reuters
This link gives the trend from 1989 to 2009.
Just in case the links are lost in time, I'm attaching the data in documeted form here:
Fuel Prices in India 1989 to 2011.docx
First, the
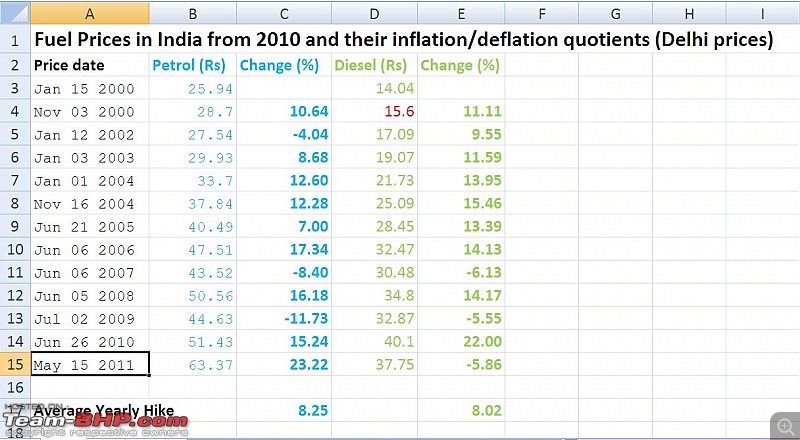
Annual trend of fuel prices in India over the last decade from 2000 to 2011 is as follows (based on fuel prices of above links):

So my earlier assumption of 10% hike would have been correct had there not been two corrections in prices between 2001 and 2009. However, I now realise that the government is perhaps trying to keep the prices in step with an inflation of 8%. Based on the historical facts, I projected an 8% price hike and reworked the Excel sheet.
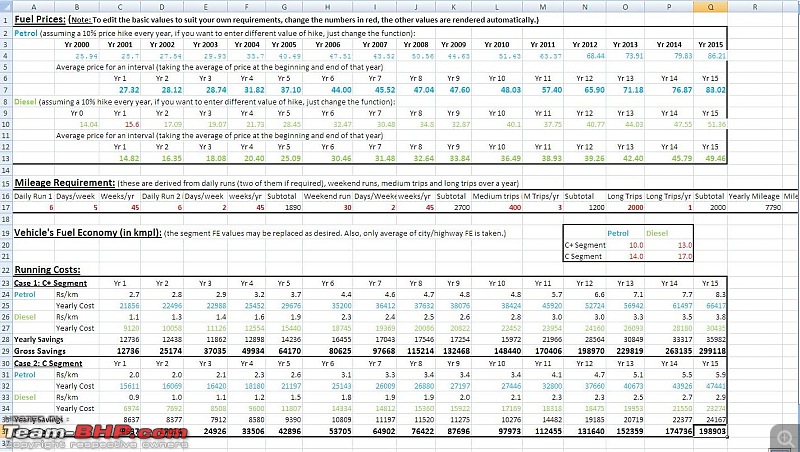
First, let's take a look at what the break even has been like over the
last decade. I just input raw data of fuel prices from 2000 to 2011 and then filled 8% growth of price till 2015. The results are here (click to see readable figures):

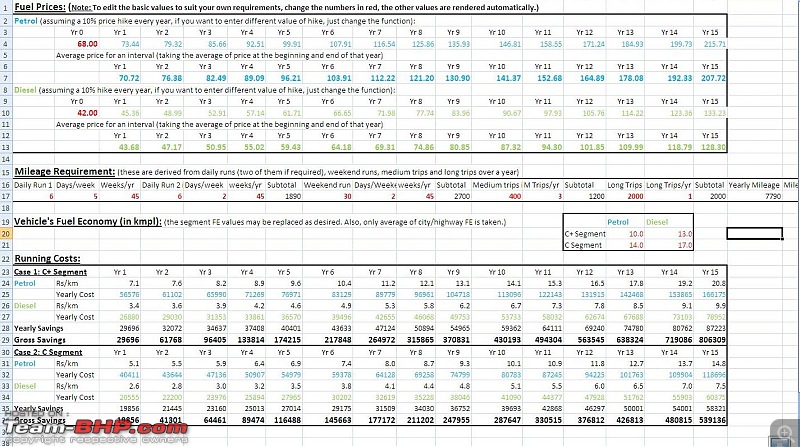
Then, as brought out by our friend dot, it may not happen that fuel prices keep inflating perpetually due to crude futures' impact on the dollar. If the global crude were to be kept stabilised at the current rates, even then the prices would still inflate at around 8% inflation owing to Indian economy (the government may pit the oil companies to manage the prices within the range of inflation and growth rates). I think that this would give a way for the government to reduce diesel subsidies gradually (more on this later). I really don't think crude will remain stable over protracted durations what with political unrests in the middle easts every now and then (some projections stating the crude to reach 200 or even 300 $/barrel if Saudi erupts in turmoil). but like the facts of last decade demand, here is the sheet for a hike at 8%:

If the above figures of 8% hike seem too much, I also put in a sheet with a projected price hike of only 4% per year. It should make a lot of difference, no? It doesn't. Even with a reduced hike per year, the break even just gets pushed away by a maximum of one year. This is because the difference in petrol and diesel is too enormous already. See here:

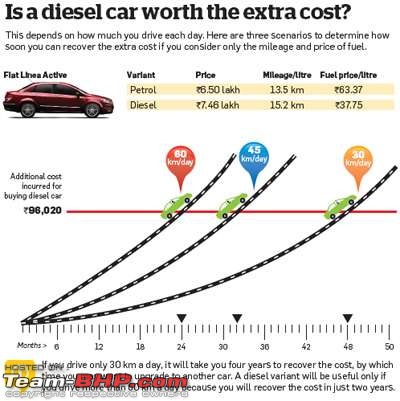
Some observations can now be confidently made. What our skeptical friends have claimed to know all along, is shown in the historical break even period of ~8 yrs (C+ Segment) and ~10-11 yrs (C Segment). That's the basis. And that is not what this whole exercise was about. It was about the sheer extent of reduction of break even periods with the present divide in petrol/diesel prices. As can be seen, the break even has come down to 3-3.5 yrs (C+ Segment) and more importantly, 4-5 yrs (C Segment). And this is with a running of 8 K km/yr. If the mileage is more, it comes in even earlier. What this means is that even consideration of interest on money saved, along with the interest on it, on initial purchase of petrol over diesel, would get overwhelmed by such a reduction of break even periods.
Factoring in actual figures of initial purchase, interests saved, loans and EMIs, interest on running costs saved, all this would vary wildly from car to car model and from person to person. The excel calculator can be used for specific requirements but a general 'one size fits all' type of formula cannot be put in here.
Getting back to diesel deregulation, I think the government will have to get serious about diesel deregulation in about 2-3 years from now, at least partially. And that would be because it would become an issue impossible to put off by then. I really don't know how it's going to happen but with deregulation of petrol, the signs are already up.
Cheers.


 (4)
Thanks
 (1)
Thanks
 (3)
Thanks
 (1)
Thanks
 (2)
Thanks

 (1)
Thanks
 (4)
Thanks


 . So I didn't pay any premium for diesel car. So every kilometer I drive, I save money. When I was out in market I wan keen on purchasing Honda City V MT as it was the best, but VW made the cut and it has a oil burner under the hood for the same price. What do fellow Bhpians have to say?